Animated bar race
Watch category rankings update with smooth transitions.

Apache ECharts for Plotly Dash
Browse chart families and see short previews of animation, zoom, and map selection. Open the documentation or source to build the interactive examples yourself.

Selected examples
These previews use bundled sample data. Each interaction is captured from the local Dash gallery.
Watch category rankings update with smooth transitions.
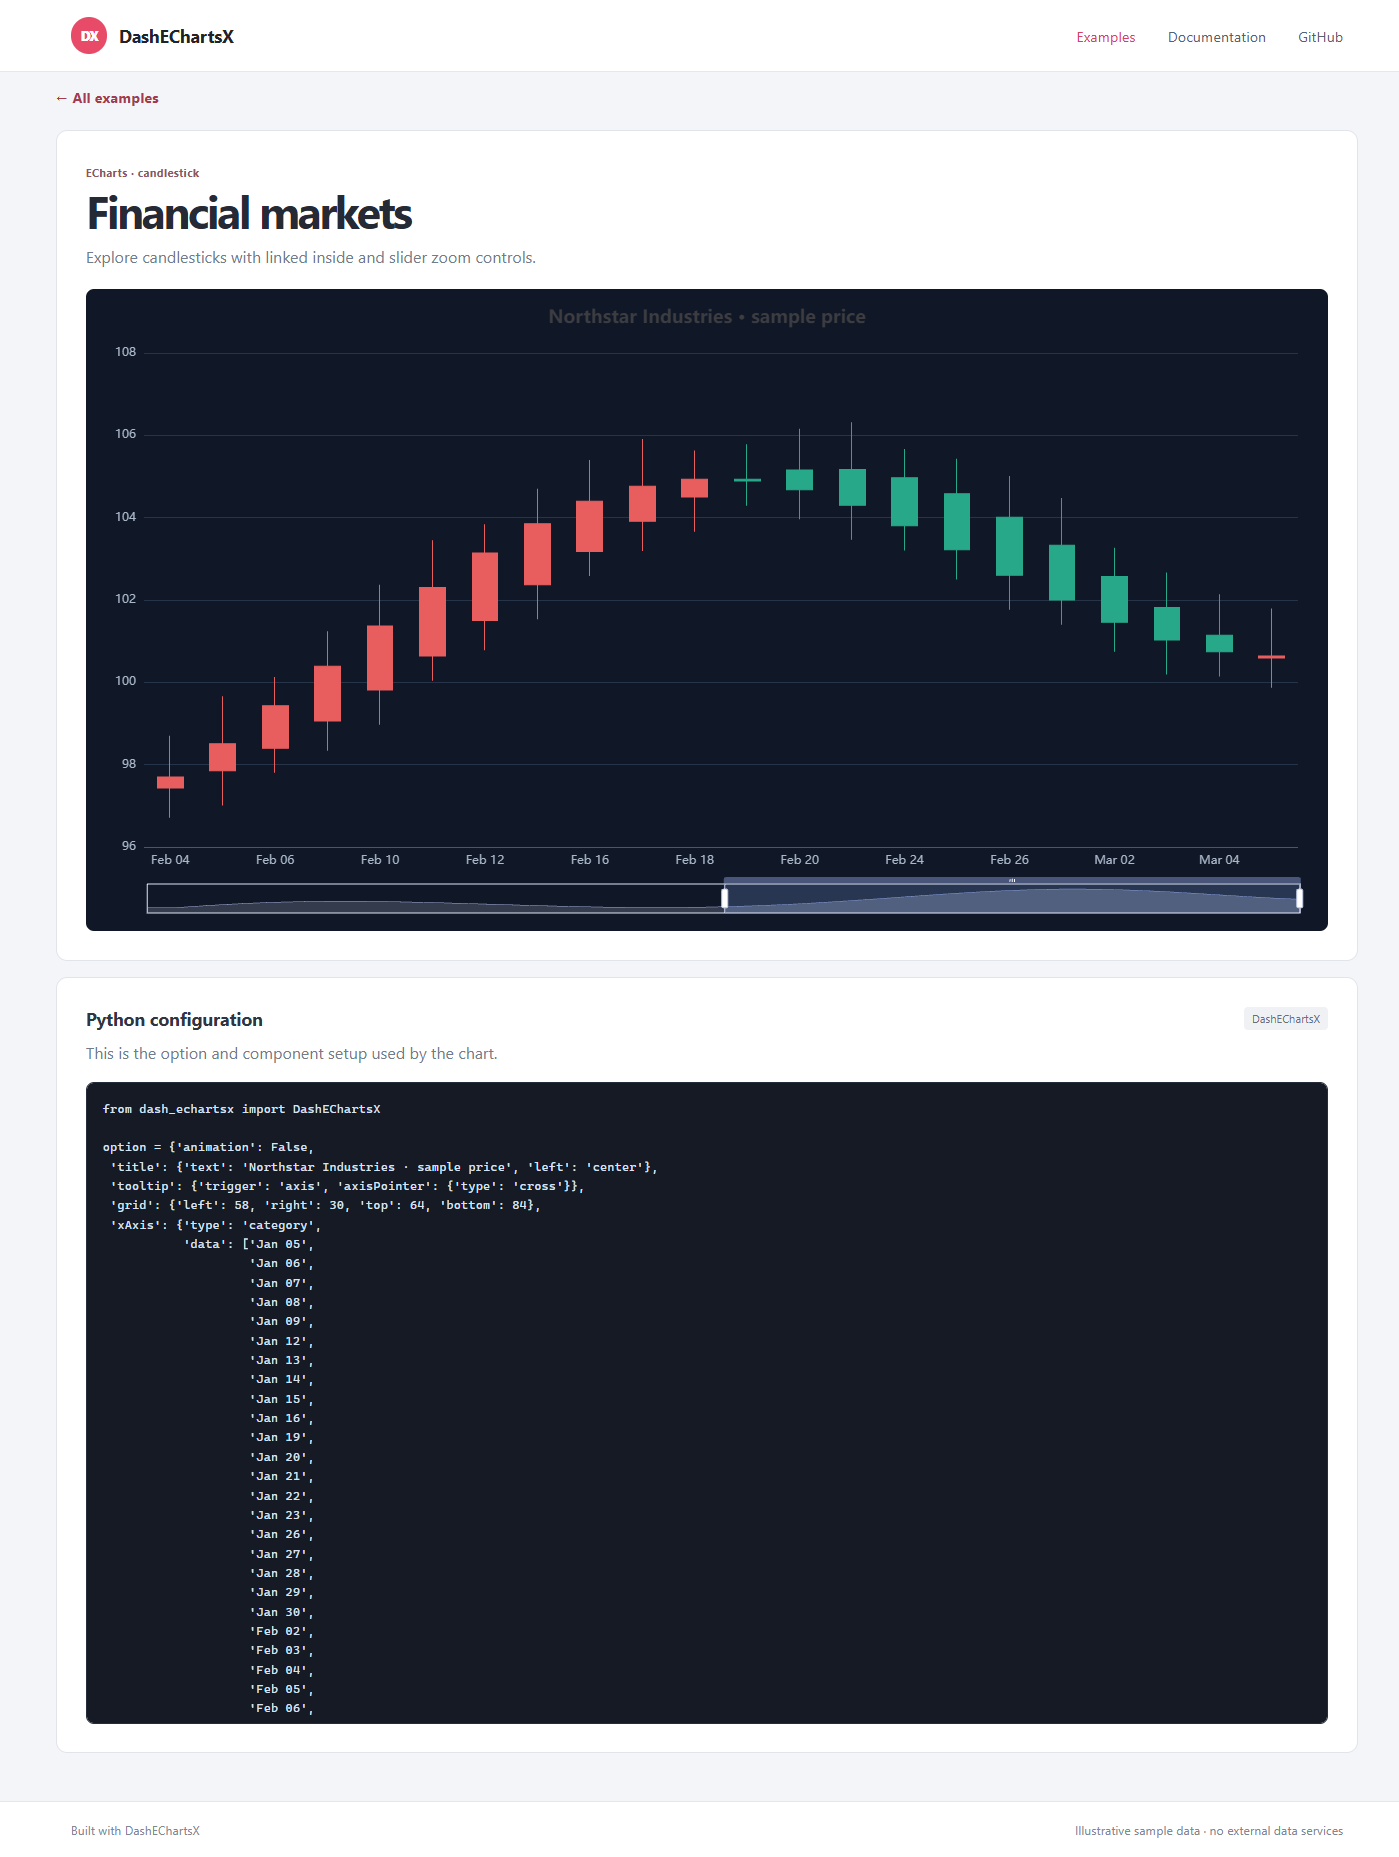
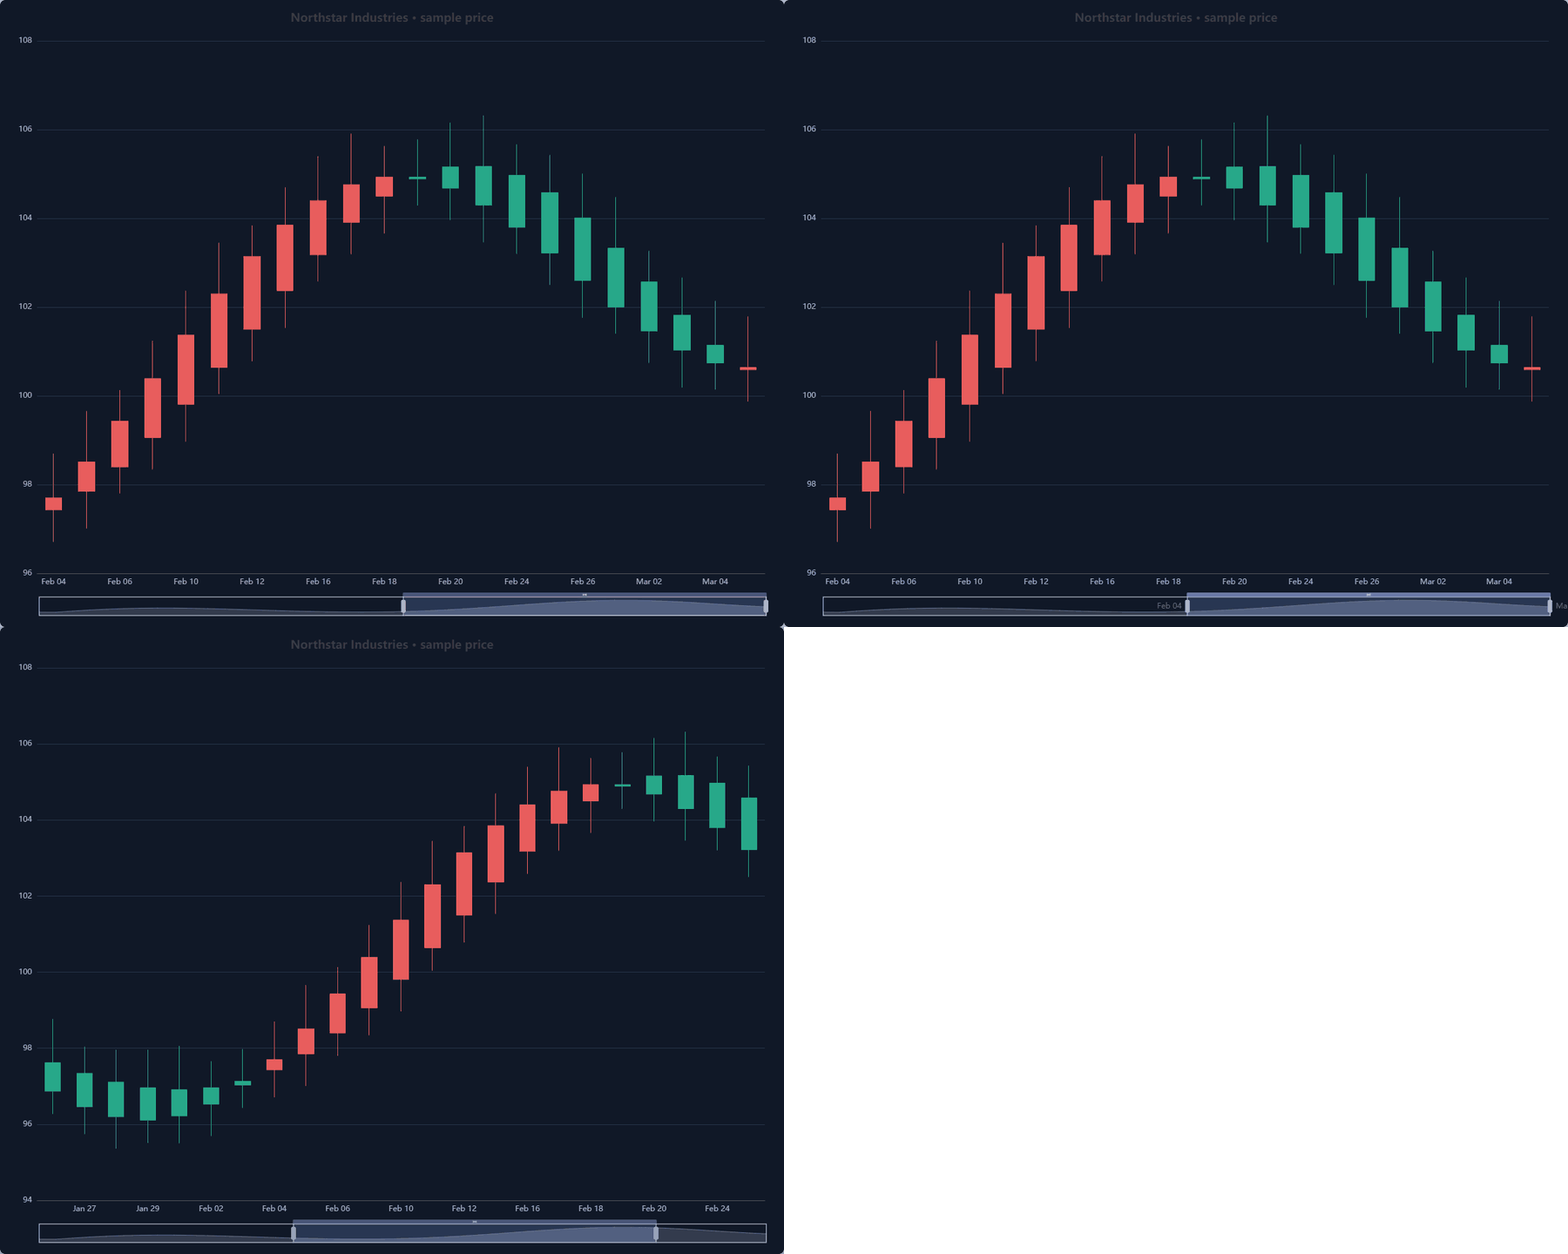
Inspect candlesticks and zoom into a date range with the slider.
Select a GeoJSON boundary to report its sample index.